Seattle & Eastside Real Estate Market
Less Volatility Than Expected
While this year has felt quite volitile with federally mandated real estate changes, fluctuating mortgage rates and a heated election, when looking at the overall trends of the year, the real estate market in King and Snohomish Counties behaved somewhat normally with a slow in January, an uptick in demand and pricing in Spring, followed by a slow in December. Below we show you these trends by breaking down Median Listing Price and Market Action Index.
Reminder to think of the Market Action Index as “miles per hour” for the market.

Seattle, WA:
Seattle started the year with 645 listings and wrapped up with 820. We've noticed that Seattle's market is influenced by interest rates—when rates drop, prices tend to go up. If mortgage interest rates start to fall in 2025, you can expect a boost in the seller's market, which may lead to multiple offers and rising prices.

Trending Prices:
The median listing price for Seattle in January was $993K, climbed to $1.1M by August, and settled back to $992K in December.

Market Speed:Seattle's Market Action Index (MAI) started at 52 in January, accelerated to 72 in April, and has since slowed to 47 in December due to the Holidays.

Bellevue, WA:
While Bellevue has behaved traditionally when it comes to speed of the market, the Median List Price has skyrocketed $200K above the Spring peak. This is due to limited inventory and more buyers using capital not reliant on financing impacted by high mortgage rates.

Trending Prices:
Bellevue began the year at $3M, rose to $3.2M in April, dipped to $2.8M in July, and finished very strong at $3.2M in December.

Market Speed: The Market Action Index for Bellevue rose from 49 in January to a peak of 66 in May, before stabilizing at 50 by year-end.
Mortgage Rate Behavior:
Where were rates at year over year?
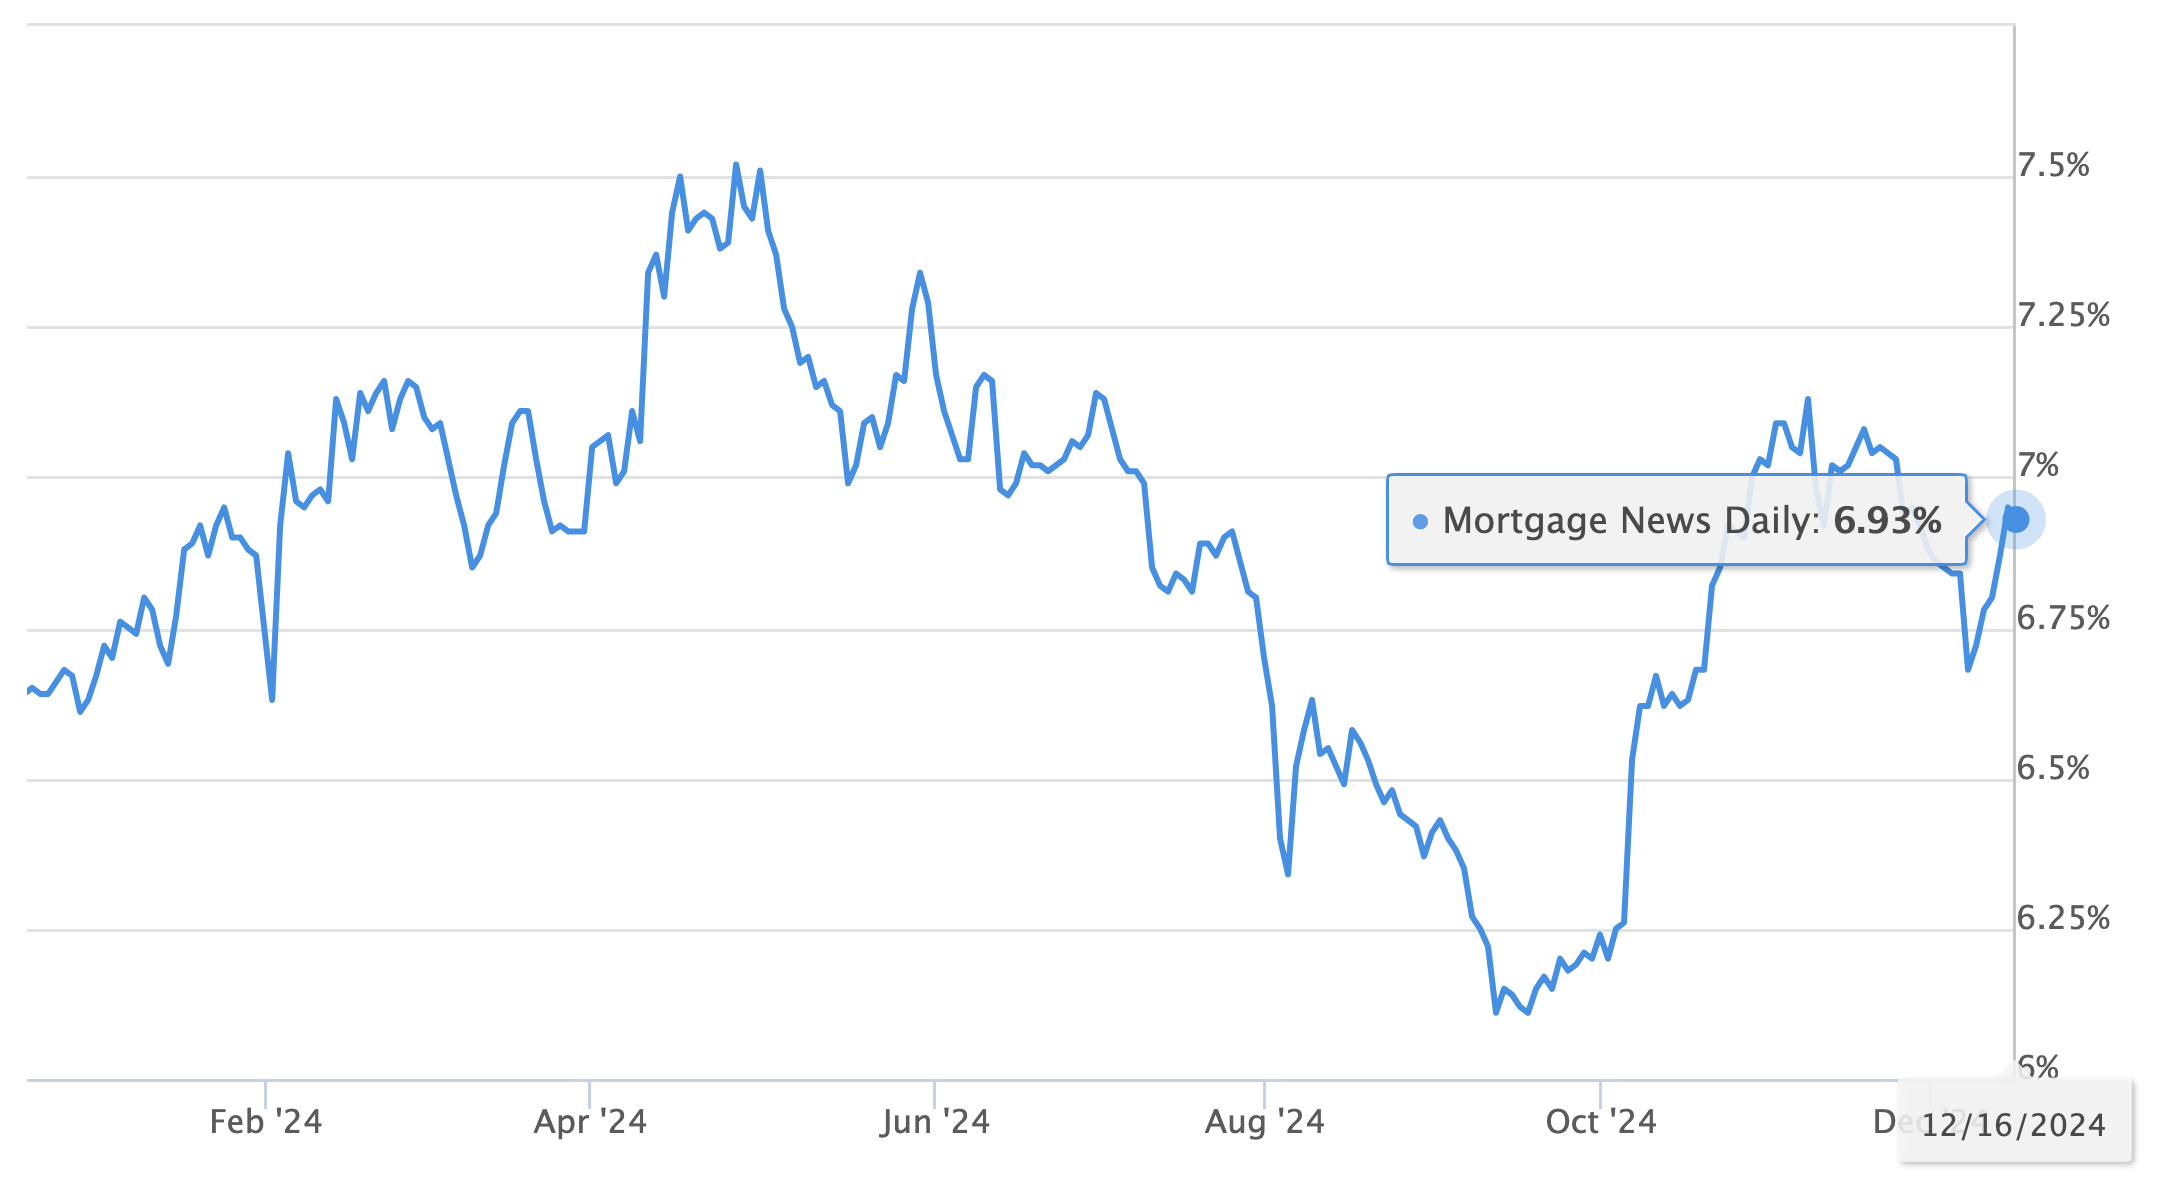
You can see in the above chart, mortage rates were at 6.7% in January, peaked at 7.5% in April, dipped to 6.11% in September, and has steadily risen to around 6.93% today.
Looking Ahead In 2025
Despite all of the changes in 2024, the real estate market was realitively normal compared to pre-covid markets. We expect 2025 to follow suite.
We expect interest rates to vary between 5.8% and 6.5% next year. This fluctuation should attract more buyers, increase listings, and likely create an even more advantageous market for sellers. When rates decreased in 2024, we observed multiple-offer situations and quick sales. As rates rose, the market paused, then became active again when they lowered.
We anticipate a consistent stream of motivated buyers who are more selective, and sellers who can distinguish themselves by showcasing their homes at their finest. With careful preparation and the right strategy, 2025 could be a great year for sellers.